Dive deeper into the realms of software debugging with GDB Baby Step 3. This engaging and challenging exercise tests your ability to scrutinize and comprehend memory at a granular level.
As we advance from GDB Baby Step 2, we now turn our focus to examining memory bytes. The task at hand?
Unravel the four bytes of memory where the constant 0x2262c96b is loaded.
This puzzle puts your reverse engineering skills to the test, offering you a practical and exciting way to delve deeper into the world of software debugging and memory exploration.
Do you think you’re ready for this challenge? If you’re new to reverse engineering, or if you’d like to refresh your knowledge, we recommend our comprehensive guides on reverse engineering and PicoCTF reverse engineering challenges.
Together, let’s navigate the intricacies of memory exploration with GDB Baby Step 3.
Building Your Skills: The Importance of Prior Steps
As you stand at the threshold of this challenge, GDB Baby Step 3, you may feel a sense of trepidation if you haven’t ventured into the previous tasks. Is it like leaping off a high cliff into uncharted waters without a life jacket? Not necessarily. At Stackzero.net, we believe in equipping our readers with the skills and knowledge to navigate even the most complex challenges. Therefore, we strongly recommend that you review and master the concepts discussed in GDB Baby Step 1 and GDB Baby Step 2 before taking on this task. Just as building a house requires a strong foundation, these initial stages serve as the bedrock upon which your understanding of GDB and reverse engineering can firmly stand.
In case you need to become more familiar with picoCTF and reverse engineering, I suggest you take a look at the articles:
- Unravelling the Secrets of Reverse Engineering: Practical Applications for In-Depth Analysis
- A Beginner’s Guide to PicoCTF’s Reverse Engineering: Simple Writeups
- PicoCTF: Crack ‘GDB Test Drive’ Challenge In Practice
The Advantage of Sequential Learning
The progressive approach we adopt here at Stackzero.net is not without good reason. Our guides on GDB Baby Step 1 and GDB Baby Step 2 are meticulously curated to provide you with a gradual introduction to GDB’s operations. They not only delve into the world of registers and calling conventions but also demystify these critical elements you’ll need to master as you prepare for GDB Baby Step 3. If you find yourself at the starting line of this challenge without having completed the previous steps, we urge you to take a pause. Utilize this opportunity to revisit and understand these essential guides: GDB Baby Step 1 and GDB Baby Step 2. We assure you that these preparatory steps will significantly smoothen your journey into GDB Baby Step 3, making it a more enjoyable and rewarding learning experience.
Setting the Stage: Preparing for the GDB Baby Step 3 Challenge
As we prepare to embark on the GDB Baby Step 3 challenge, let’s first ensure our workspace is primed for the task at hand. Begin by launching your Kali virtual machine, a trusted companion for any cybersecurity enthusiast.
Once your virtual environment is up and running, and you are registered to the platform navigate to the PicoCTF platform. From the homepage, select ‘Practice,’ followed by the ‘Reverse Engineering’ section. Seek out ‘GDB Baby Step 3’ among the listed challenges, your destination for this learning journey.

Having located the challenge, your next task is to download the accompanying file, ‘debugger0_c.’ Upon successful download, move this file into your preferred working directory.
Organizing your files in a familiar workspace can streamline your efforts and minimize distractions.
I usually create a directory for every challenge or group of challenges.
With ‘debugger0_c’ in place, open a terminal in the current directory. Your terminal, akin to your control centre, will be your primary tool for dissecting and debugging the program.

Now, just to have a bit more info on our challenge, let’s use the “file” command to know more.

That’s an ELF file, so we can proceed with our analysis.
Having followed these steps, you’re now set up for success. All that’s left is to brace yourself for the intricate yet rewarding process of reverse engineering.
Embrace the challenge, apply your knowledge, and let’s conquer GDB Baby Step 3 together.
In Action: Unraveling the Challenge
Preliminary Phase
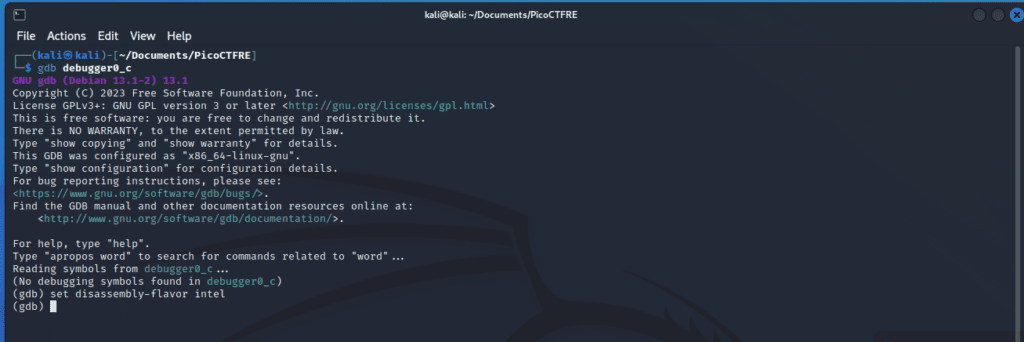
Let’s step into the heart of this challenge: it’s time to get our hands on the debugger0_c file and initiate our debugging session with GDB. Here, we’ll make use of the command:
gdb debugger0_cto launch the debugger.
To ensure consistency with our prior practice, we’ll continue using the Intel syntax for disassembly. This can be accomplished by running the command:
set disassembly-flavour intel
After this initial setup, we should collect some pertinent information for our task. Primarily, we need the names of the functions and the disassembly of the main function. The command
info functionFrom this list, the function that stands out for our interest is ‘main‘. We can proceed to disassemble it using the command
disassemble main
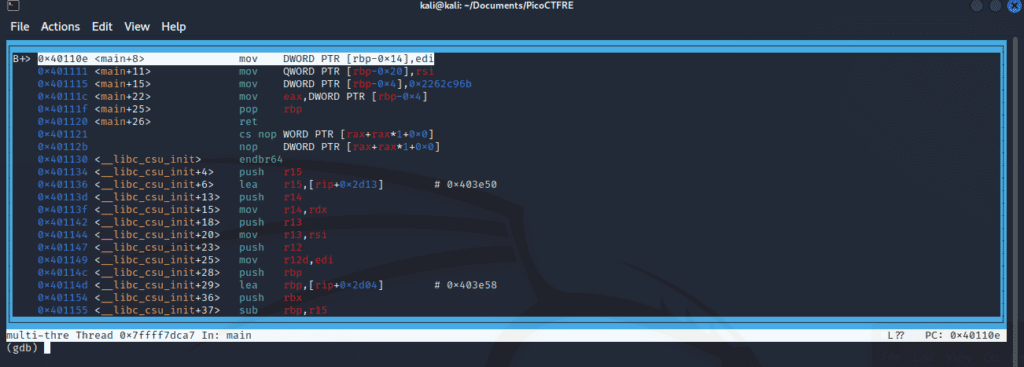
Our objective now turns towards the contents of the memory where it moved the value of interest. Upon inspection of the disassembled ‘main’, we note an interesting instruction. This instruction moves the constant value into a memory location (determined by RBP – 4).
Debugging Phase
To gain a practical understanding of what’s happening, we must execute the program up to this point. This calls for setting a breakpoint at the start of ‘main‘ with
break mainand subsequently running the program with
runWe also employ
layout asmto ensure the program’s execution is displayed in an easily readable assembly layout.

As the program halts at our breakpoint, it’s apparent from the screenshot that the final value in the EAX register is fetched from memory. To confirm this, we set another breakpoint at the instruction address 0x40111f (where EAX is set) using
break *0x40111f and continue execution with
cGetting The Flag
We can inspect the contents of the EAX register at this point by running
info registers eaxHowever, this is not our flag. The ‘file’ command indicates the use of a little-endian representation, implying the bytes’ storage in reverse order. Following the challenge’s hint, we inspect the actual memory content with
x/4xb $rbp-4this is the command that will list the value

The output shows the memory content as
0x6b 0xc9 0x62 0x22e obtain the flag in the format required by the challenge:
picoCTF{0x6bc96222}
Upon submitting this, we successfully complete the GDB Baby Step 3 Challenge!
Conclusion
As we close the chapter on GDB Baby Step 3, we trust that you’ve broadened your grasp of debugging with GDB and deepened your understanding of program execution and memory management.
We hope you found this tutorial instructive and illuminating. Continue to delve into these intricacies, for there is much more to explore, learn and master. Keep an eye on our blog at stackzero.net for more tutorials, updates, and insights into the realm of programming, cybersecurity, and beyond.
Also, don’t forget to follow our social profiles for real-time updates and to be part of our vibrant community of learners and experts. As we continue this journey of learning together, each step brings us closer to becoming the experts we aspire to be.
Stay curious, stay persistent, and remember – every challenge you conquer propels you forward in your learning journey. Until the next tutorial, happy reversing!


