This article aims to be a quickstart guide about GDB, a crucial tool for reverse engineering. We will closely examine a puzzle from PicoCTF, the ‘GDB Test Drive’ challenge.
But, we’re not just solving it. We’re learning the basics of GDB. We understand how it helps with dynamic analysis in reverse engineering. And to help you out, we’ve added a GDB Cheatsheet.
This guide is for everyone – beginners and experts. So, let’s dive in and discover the power of GDB!
What is GDB?
The GNU Debugger (GDB) is a powerful open-source debugger that’s widely used in the software development and cybersecurity fields. It allows you to dissect a program while it’s running, providing invaluable insights into its behaviour, performance, and potential flaws. This ability to dynamically analyze a running program makes GDB a critical tool in areas like malware analysis and reverse engineering.
In the realm of malware analysis, GDB’s dynamic analysis capabilities come to the fore. Malware analysis involves dissecting, understanding, and evaluating the functionality, origins, and potential impact of a malware sample. This process often requires delving into the world of reverse engineering to unravel the inner workings of a malware sample and develop effective strategies to combat it. Using GDB lets you observe how the malware operates in real time, thus gaining valuable insights into its mechanisms and devising tailored countermeasures to protect your systems.
On the other hand, reverse engineering, a process that involves disassembling software to reveal its underlying architecture and functionality, has become an invaluable tool in understanding and analyzing complex systems. GDB plays a significant role in this process, mainly when focusing on the x86_64 architecture, the most common in modern computing. GDB allows you to step through the assembly code, examine registers, observe stack changes, and much more, all of which are essential in gaining a thorough understanding of the software’s functionality and structure.
By the end of this article, not only will you have solved the GDB Test Drive in PicoCTF, but you’ll have a clearer understanding of GDB’s functionalities and its uses in reverse engineering and malware analysis, enriching your cybersecurity knowledge and capabilities.
GDB Cheatsheet
Here is just an overview of the main functionalities of GDB.
- Starting and Stopping GDB
gdb: Start GDB without a file.gdb filename: Start GDB with a file.quit: Quit GDB.
- Running the Program
run: Run the program.run arguments: Run the program with arguments.
- Setting Breakpoints
break location: Set a breakpoint at a location.info breakpoints: List all breakpoints.
- Stepping Through the Program
next: Run the program until the following line.step: Step into function calls.
- Inspecting Variables
print variable: Print the value of a variable.display variable: Continually display the value of a variable.
- Inspecting Source Code
list: List the source code.list function: List the source code of a function.list line: List the source code around a specific line.
- Inspecting Assembly Code
disassemble function: Disassemble the code of a function.disassemble/r function: Disassemble the code of a function with raw opcodes.
- Inspecting Registers
info registers: Display all register values.print/d $register: Print the value of a specific register in decimal.print/x $register: Print the value of a specific register in hexadecimal.
- Inspecting the Stack
info stack: Display information about the stack.x/10wx $sp: Show the top 10 words on the stack.
Set Up the Environment for the picoCTF GDB Test Drive.
Let’s go to PicoCTF and log in there or Register with Kali Linux for this reverse engineering task. Although REMnux is a go-to for many, we’re keeping things simple with Kali.
First, we need to set up GDB. Here’s the command to install it: sudo apt install gdb.
Next, we’re heading to PicoCTF.
We’re taking on the GDB Test Drive Challenge that you can find in the Reverse Engineering category of picoCTF, among the first challenges, at the moment of the writing of this article, it’s at this address.
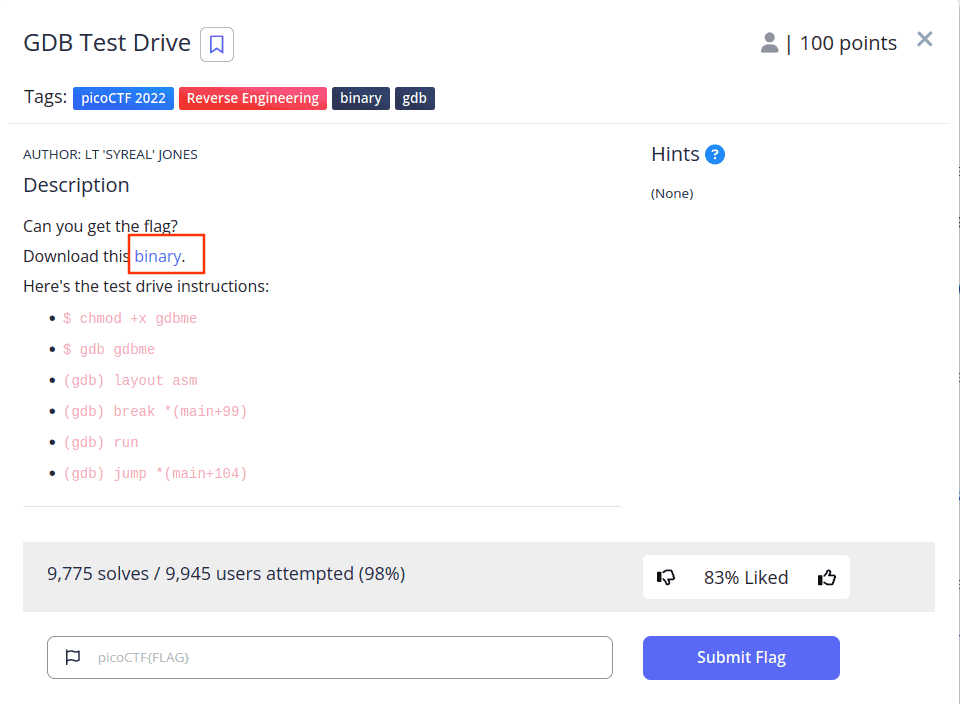
Once you click on its card, you should see a screen with the link to the binary like this that will prompt this modal

After you’ve downloaded the challenge files, find the “gdbme” file in your target folder. Let’s determine its type. Open a terminal in the same directory as your file and type: file gdbme.
That’s it! The result will reveal the file type.
gdbme: ELF 64-bit LSB pie executable, x86-64, version 1 (SYSV), dynamically linked, interpreter /lib64/ld-linux-x86-64.so.2, BuildID[sha1]=15cc42b7d1ba7d200593c720e2d9fd2e757fccca, for GNU/Linux 3.2.0, not stripped
You’ll see it’s an ELF (Executable Linux Format) file, 64-bit. The description also indicates that it’s not stripped.
Get Your Hands Dirty on PicoCTF: GDB In Practice
This PicoCTF challenge is designed to walk you through using GDB step by step. All the steps are suggested in the description.
Let’s check if everything is working fine. Open a new terminal in the directory where you downloaded the file and type:
chmod +x gdbmeBefore starting, try to execute it by typing:
./gdbmeIs clear that the program is stuck, so we can proceed with debugging:
gdb gdbmeFirstly, we grant execution permissions to the file. Secondly, we run GDB and attach it to the ELF file. Here’s what you should see:

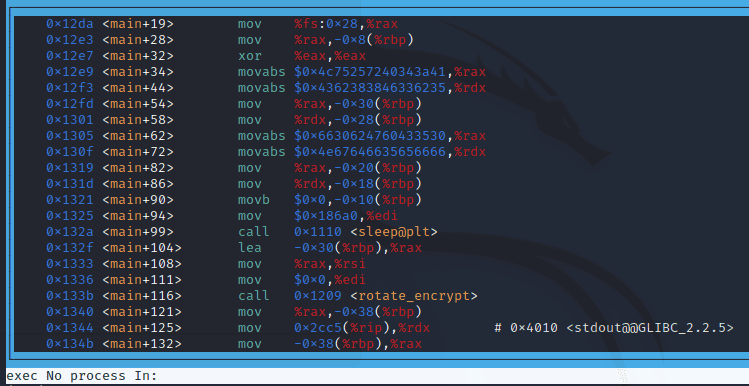
Let’s inspect the assembly code now. As per the challenge description, type in your terminal:
layout asmAnd here’s what you’ll observe:

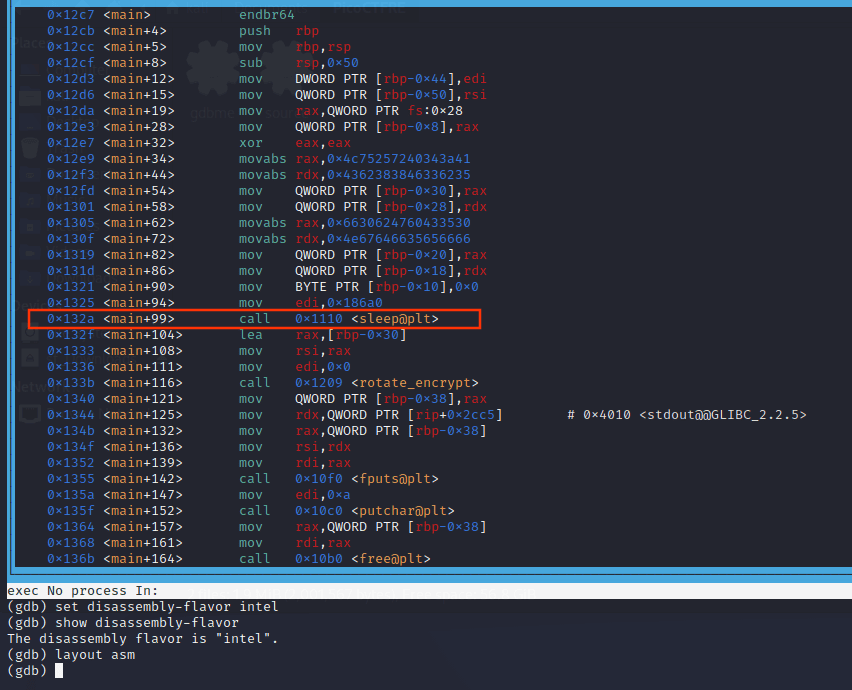
However, I prefer the intel syntax, so to change it you can use:
set disassembly-flavour intel
layout asm
Now, the assembly is displayed the way we prefer:

Note the sleep function. It takes a single unsigned int parameter, which according to the calling convention, is passed into the edi register. In this case, it’s 0x186a0, or 100000 seconds in decimal.
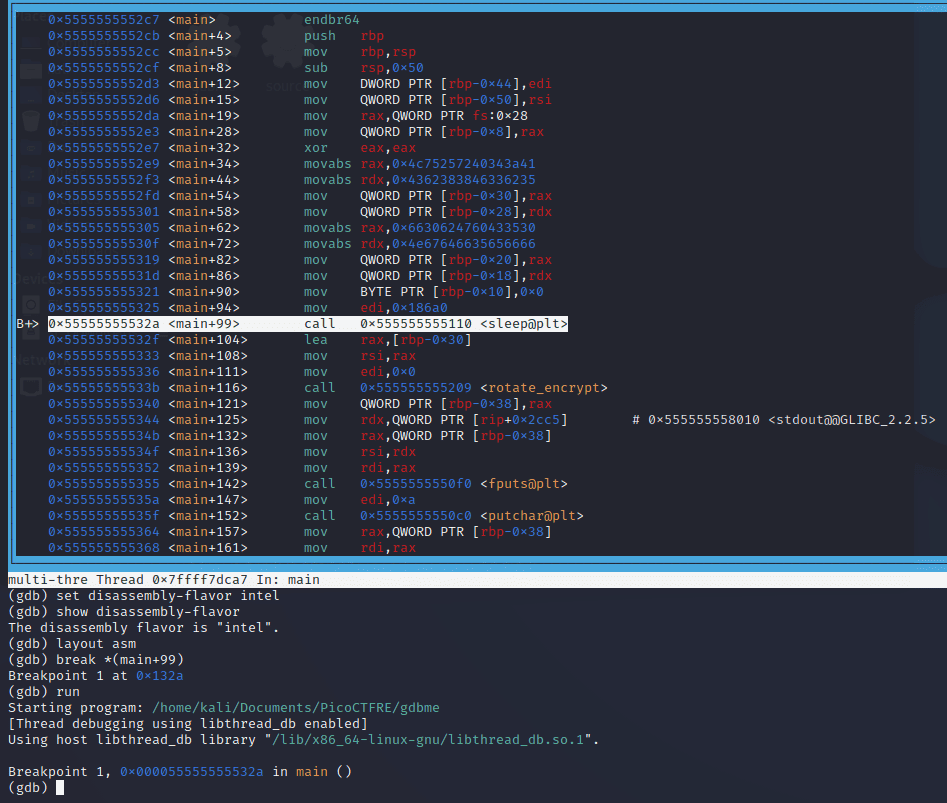
We’ll set a breakpoint and run the program.
break *(main+99)
run
The program halts at the address <main+99>. We can skip the sleep call using this command:
jump *(main+104)And voila, we have the flag!

The flag is: picoCTF{d3bugg3r_dr1v3_7776d758}
Head over to the picoCTF website, enter the flag, and complete the challenge!

Conclusion
I hope you enjoyed this walkthrough of the PicoCTF Shop challenge using GDB. This practical exercise is a great way to understand the power of GDB in debugging and reverse engineering. Remember, practice makes perfect. So, don’t stop here – keep exploring, keep learning!
For more tutorials and guides, don’t forget to follow my blog and my social media profiles. Stay tuned for more exciting content on cybersecurity, programming, and more. Until next time, happy debugging!


